
Challenge Yourself with the World's Most Realistic SPLK-2003 Test.
How is a Django filter query performed?
A. By adding parameters to the URL similar to the following: phantom/rest/container?_filter_tags_contains="sumo".
B. phantom/rest/search/app/contains/"sumo"
C. Browse to the Django Filter Query Editor in the Administration panel.
D. Install the SOAR Django App first, then configure the search query in the App editor.
Explanation: Django filter queries in Splunk SOAR are performed by appending filter
parameters directly to the REST API URL. This allows users to refine their search and
retrieve specific data. For example, to filter containers by tags containing the word "sumo",
the following URL structure would be used:
https://
The correct way to perform a Django filter query in Splunk SOAR is to add parameters to
the URL similar to the following: phantom/rest/container?_filter_tags_contains=“sumo”.
This will return a list of containers that have the tag “sumo” in them. You can use various
operators and fields to filter the results according to your needs. For more details, see
Query for Data and Use filters in your Splunk SOAR (Cloud) playbook to specify a subset
of artifacts before further processing. The other options are either incorrect or irrelevant for
this question. For example:
•phantom/rest/search/app/contains/“sumo” is not a valid URL for a Django filter query. It will
return an error message saying “Invalid endpoint”.
•There is no Django Filter Query Editor in the Administration panel of Splunk SOAR. You
can use the REST API Tester to test your queries, but not to edit them.
•There is no SOAR Django App that needs to be installed or configured for performing
Django filter queries. Splunk SOAR uses the Django framework internally, but you do not
need to install or use any additional apps for this purpose.
How does a user determine which app actions are available?
A. Add an action block to a playbook canvas area.
B. Search the Apps category in the global search field.
C. From the Apps menu, click the supported actions dropdown for each app.
D. In the visual playbook editor, click Active and click the Available App Actions dropdown.
Explanation: In Splunk SOAR, a user can determine which app actions are available by navigating to the Apps menu. From there, the user can click on the supported actions dropdown for each app to view the actions that can be performed by that app. This dropdown menu provides a list of all the actions that the app is capable of executing, allowing the user to understand the functionality provided by the app and how it can be utilized within playbooks11.
How can parent and child playbooks pass information to each other?
A. The parent can pass arguments to the child when called, and the child can return values from the end block.
B. The parent can pass arguments to the child when called, but the child can only pass values back as new artifacts in the event.
C. The parent must create a new artifact in the event named arg_xxx, and the child must return values by creating artifacts with the naming convention return_xxx.
D. The parent must create a new artifact in the event named return_xxx, and the child must return values by creating artifacts with the naming convention arg_xxx.
Explanation: In Splunk SOAR, parent and child playbooks can pass information between each other using arguments. The parent playbook can pass specific arguments to the child playbook when it is called, enabling the child playbook to utilize these values in its execution. Once the child playbook finishes its execution, it can return values through the end block. This mechanism allows for efficient and structured communication between parent and child playbooks, enabling complex, multi-step automation workflows. Other options are incorrect because creating artifacts with specific naming conventions is not necessary for passing information between playbooks, and artifacts are not used for argument or result passing between playbooks in this manner.
Which of the following are examples of things commonly done with the Phantom REST APP?
A. Use Django queries; use curl to create a container and add artifacts to it; remove temporary lists.
B. Use Django queries; use Docker to create a container and add artifacts to it; remove temporary lists.
C. Use Django queries; use curl to create a container and add artifacts to it; add action blocks.
D. Use SQL queries; use curl to create a container and add artifacts to it; remove temporary lists.
Explanation: The Phantom REST API, often interacted with through the Phantom REST APP, is a powerful tool for automating and integrating Splunk SOAR with other systems. Common uses of the Phantom REST APP include using Django queries to interact with the SOAR database, using curl commands to programmatically create containers and add artifacts to them, and configuring action blocks within playbooks for automated actions. This flexibility allows for a wide range of automation and integration possibilities, enhancing the SOAR platform's capability to respond to security incidents and manage data.
Seventy can be set during ingestion and later changed manually. What other mechanism can change the severity or a container?
A. Notes
B. Actions
C. Service level agreement (SLA) expiration
D. Playbooks
Explanation: The severity of a container in Splunk Phantom can be set manually or automatically during the ingestion process. In addition to these methods, playbooks can also change the severity of a container. Playbooks are automated workflows that define a series of actions based on certain triggers and conditions. Within a playbook, actions can be defined to adjust the severity level of a container depending on the analysis of the event data, the outcome of actions taken, or other contextual factors. This dynamic adjustment allows for a more accurate and responsive incident prioritization as new information becomes available during the investigation process.
What metrics can be seen from the System Health Display? (select all that apply)
A. Playbook Usage
B. Memory Usage
C. Disk Usage
D. Load Average
System Health Display is a dashboard that shows the status and performance of the SOAR
processes and components, such as the automation service, the playbook daemon, the
DECIDED process, and the REST API. Some of the metrics that can be seen from the
System Health Display are:
Therefore, options B, C, and D are the correct answers, as they are the metrics that can be
seen from the System Health Display. Option A is incorrect, because Playbook Usage is
not a metric that can be seen from the System Health Display, but rather a metric that can
be seen from the Playbook Usage dashboard, which shows the number of playbooks and
actions run over a period of time.
1: Web search results from search_web(query="Splunk SOAR Automation Developer
System Health Display")
The System Health Display in Splunk SOAR provides several metrics to help monitor and
manage the health of the system. These typically include:
Which of the following roles is appropriate for a Splunk SOAR account that will only be used to execute automated tasks?
A. Non-Human
B. Automation
C. Automation Engineer
D. Service Account
Explanation: In Splunk SOAR, the appropriate role for an account that will only be used to
execute automated tasks is the “Automation” role. This service account role is specifically
designed for automated tasks, including REST API operations, playbook execution, and
ingestion. It is intended for use by systems rather than human users and provides the
necessary permissions for automated interactions with the SOAR platform1.
References:Splunk SOAR documentation on managing roles and permissions1.
In Splunk SOAR, the “Automation” role is designed specifically for accounts that are
intended for executing automated tasks. These tasks can include REST API operations,
playbook actions, and data ingestion processes. The Automation role is a type of service
account role intended for system-to-system interactions and is not meant to be used by
human operators. It provides a tailored set of permissions that allows for the execution of
automated processes without granting broader access that would be unnecessary or
insecure for an automated account.
The designation of this role is critical in maintaining proper security and operational
boundaries within the SOAR platform. By restricting the automated account to just the
Automation role, Splunk SOAR ensures that automated processes run with the least
privilege necessary, reducing the risk of unauthorized actions and maintaining a clear
separation between human users and automated systems.
What are the differences between cases and events?
A. Case: potential threats.
Events: identified as a specific kind of problem and need a structured approach.
B. Cases: only include high-level incident artifacts.
Events: only include low-level incident artifacts.
C. Cases: contain a collection of containers.
Events: contain potential threats.
D. Cases: incidents with a known violation and a plan for correction.
Events: occurrences in the system that may require a response.
Explanation: In Splunk SOAR, an event is a security occurrence that may require a response. It is ingested from a third-party source and can be labeled to group related events together. The default label for containers is “Events,” which signifies potential threats13. A case, on the other hand, is a container that holds several containers, consolidating multiple events into one logical management unit. Cases can include artifacts and external evidence such as screen captures, analyst notes, and event data from thirdparty products22. They are used to manage and analyze investigation data tied to specific security events and incidents, providing a structured approach to incident response34.
Which of the following are the default ports that must be configured on Splunk to allow connections from SOAR?
A. SplunkWeb (8088), SplunkD (8089), HTTP Collector (8000)
B. SplunkWeb (8089), SplunkD (8088), HTTP Collector (8000)
C. SplunkWeb (8000), SplunkD (8089), HTTP Collector (8088)
D. SplunkWeb (8469), SplunkD (8702), HTTP Collector (8864)
Explanation: For Splunk SOAR to connect with Splunk Enterprise, certain default ports must be configured to facilitate communication between the two platforms. Typically, SplunkWeb, which serves the Splunk Enterprise web interface, uses port 8000. SplunkD, the Splunk daemon that handles most of the back-end services, listens on port 8089. The HTTP Event Collector (HEC), which allows HTTP clients to send data to Splunk, typically uses port 8088. These ports are essential for the integration, allowing SOAR to send data to Splunk for indexing, searching, and visualization. Options A, B, and D list incorrect port configurations for this purpose, making option C the correct answer based on standard Splunk configurations. These are the default ports used by Splunk SOAR (On-premises) to communicate with the embedded Splunk Enterprise instance. SplunkWeb is the web interface for Splunk Enterprise, SplunkD is the management port for Splunk Enterprise, and HTTP Collector is the port for receiving data from HTTP Event Collector (HEC). The other options are either incorrect or not default ports. For example, option B has the SplunkWeb and SplunkD ports reversed, and option D has arbitrary port numbers that are not used by Splunk by default.
In this image, which container fields are searched for the text "Malware"?
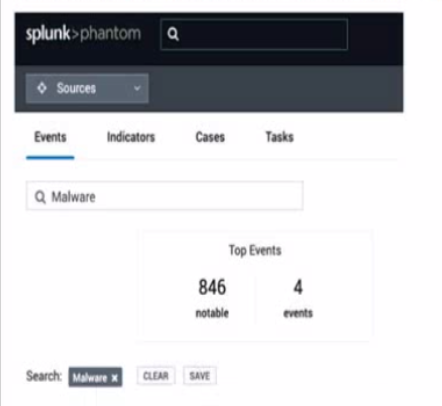
A. Event Name and Artifact Names.
B. Event Name, Notes, Comments.
C. Event Name or ID.
Explanation: The image shows a user interface of “splunk>phantom” with a search bar at the top, where a search for “Malware” has been initiated. The tabs labeled “Events,” “Indicators,” “Cases,” and “Tasks” suggest that the search functionality could span across various container fields within the Splunk SOAR environment. Typically, the search would include fields that are most relevant to the user’s query, which in this case, are likely to be the Event Name and Artifact Names. These fields are central to identifying and categorizing events and artifacts within Splunk SOAR, making them primary targets for a search term like “Malware” which is commonly associated with security events and indicators17.
| Page 3 out of 11 Pages |
| Splunk SPLK-2003 Dumps Home | Previous |
Contact Us - Privacy Policy ... Copyright © - All Rights Reserved